 Pay My Bills
 Report a Problem
 Start / Stop/ Move Service
 Business
Water Services
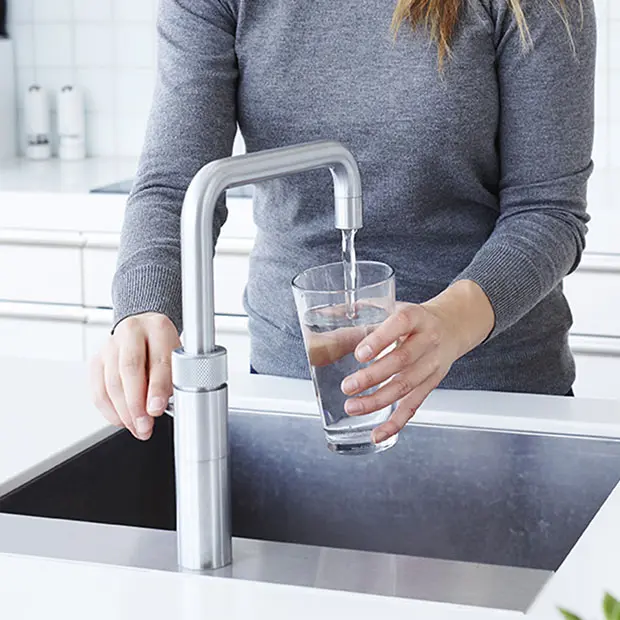
We are committed to providing safe, high-quality, great-tasting water today and for generations to come.
OUC’s High Quality Water
OUC has a proven track record of producing water that meets the highest standards of purity.

How We Naturally Source Water
OUC’s water comes from the Lower Floridan Aquifer, fed by rainwater through a natural cleansing process.
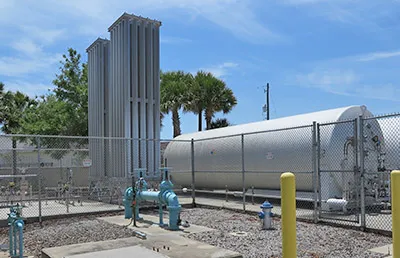
Ozone Treatment for Superior Taste
OUC treats the water to ensure safety and uses an advanced ozone treatment process to remove unpleasant tastes and odors.
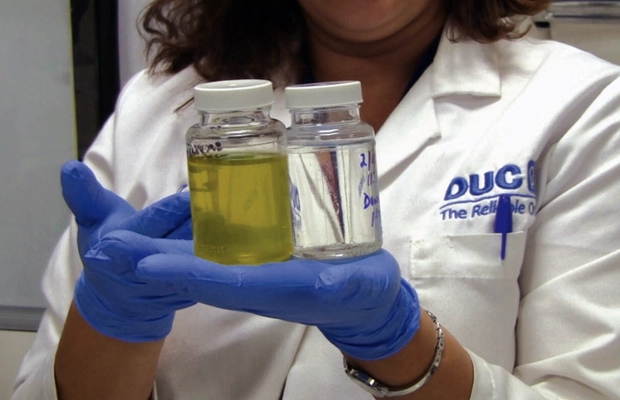
Quality Testing in a Certified Laboratory
OUC’s Certified Water Quality Laboratory performs thousands of chemical and bacteriological tests annually to ensure that your drinking water meets or exceeds all state and federal regulations.

Planning for the Future
OUC is leveraging technology to conserve water, a precious and limited resource, and evolving to meet increasingly complex challenges.
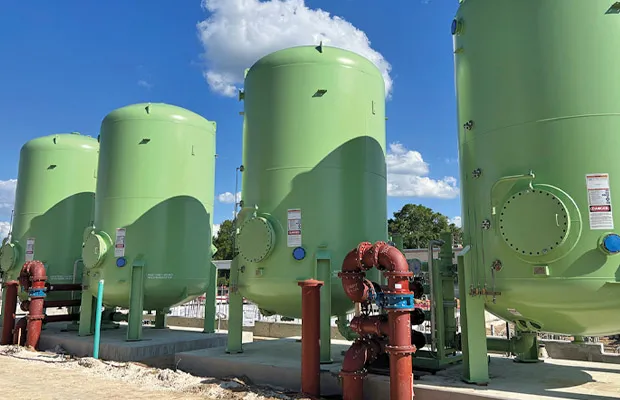
State-of-the-Art Water Distribution System
OUC provides water service to residents and businesses within the City of Orlando and portions of Orange County.

Distribution System
OUC pumps about 35 billion gallons of water per year to customers across a 200-square-mile service area.
High-Security Guarded Facilities
All seven of OUC water plants are patrolled by armed security guards and law enforcement and are equipped with state-of-the-art security systems that include intrusion-detection systems, alarms, cameras and security fences.

Smart Technology to Detect & Prevent Leaks
OUC monitors the water distribution system for leak sounds, which are recorded and analyzed using algorithms and mapping tools to pinpoint potential leak locations. Once identified, crews are dispatched for quick repairs.
Conserve Your Water
It’s important and easy for all Floridians to practice water conservation.
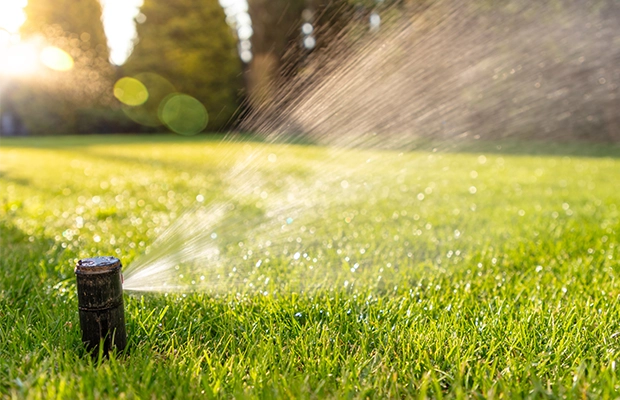
Watering Restrictions
Watering is allowed twice a week during Daylight Saving Time and once a week during Eastern Standard Time, with watering days based on your address.
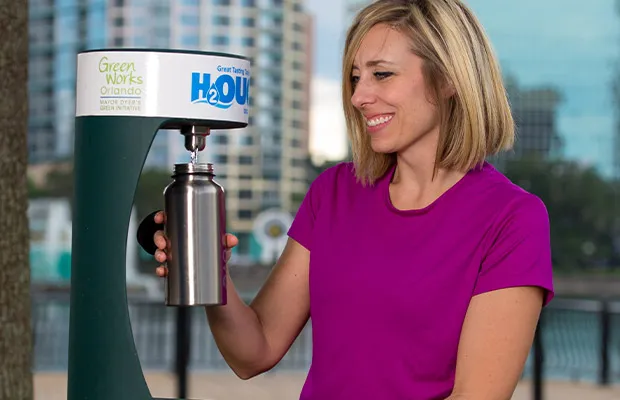
H2OUC Hydration Stations
These water stations, located at parks and community centers, provide an easy way to refill reusable bottles.

Water Quality Report
OUC’s Water Quality Report shares data and test results that affirm our commitment to providing reliable access to great-tasting and clean H2O while protecting and preserving the public’s water supply.
OUC’s Commitment to High-Quality Water:
Lead & Copper Testing
OUC provides lead and copper testing in schools and daycares to ensure water safety. Learn about testing, regulations and our commitment to water quality.
Frequently Asked Questions
Is chlorine added to the water?
Yes, the average concentration is 1.0 ppm (parts per million)
Does OUC use chloramines?
No.
What is the hardness of my water?
The average hardness of OUC water is 129 ppm or 7 gpg (grains per gallon).
Does OUC add fluoride to its water?
OUC stopped adding fluoride to drinking water on July 1, 2025, per state law. On May 20, 2025, Governor Ron DeSantis signed the Florida Farm Bill (Senate Bill 700), which bans certain additives in water, including fluoride, effective July 1, 2025.
Naturally occurring fluoride, which exists in Florida groundwater at an average concentration of 0.14 milligrams per liter (mg/L), will remain.
Our water is sourced from the Lower Floridan Aquifer, a protected and reliable source used by OUC since 1957. OUC’s Water Quality Laboratory will continue its rigorous testing practices to monitor naturally occurring fluoride and ensure compliance with all drinking water standards.
What Are PFAS Compounds and Where Are They Found?
PFAS are a group of manufactured chemicals that have been widely used in industry and consumer products since the 1940s. PFAS are noted for their resistance to heat, oil, stains, grease, and water. Considered “forever chemicals” because they do not degrade easily, PFAS are used in a variety of everyday products – non-stick cookware, furniture, electronics, medical devices, clothing, dental floss, pizza boxes and more – and throughout the environment, which makes it very difficult to establish limits solely for water.
Although there are multiple ways PFAS enter the environment, the main sources of PFAS contamination into the air, soil, and water are manufacturing plants, industrial facilities, waste storage and treatment sites, and similar locations. People can be exposed through using consumer goods, drinking contaminated water, eating contaminated food, especially fish, or breathing in contaminated dust. A proposed federal rule would require companies to disclose products made with PFAS. Learn More.
Does OUC monitor and test for PFAS in drinking water?
In 2024, the EPA announced newly established national limits for six types of perfluoroalkyl and polyfluoroalkyl substances (PFAS) in drinking water. OUC complies with federal PFAS regulations, and we will continue regular testing and reporting as required.
What is the source of OUC water?
OUC water comes from the lower depths of the Floridian Aquifer, a quarter of a mile below the earth’s surface. This deep water supply is protected from contaminants, pollutants, and bacteria that might affect surface water supplies. This pristine water requires little treatment.
How is the water processed?
Through our five-year Water Project 2000 initiative, OUC has shifted to an advanced ozone treatment process that produces great-tasting tap water. By treating our water with ozone, a strong and safe disinfectant, OUC reduces the use of chlorine in its water system and removes hydrogen sulfide, a naturally occurring compound that can create an unpleasant taste and odor.
How can we be sure OUC water is safe?
Annually, we conduct approximately 12,000 water quality tests on a periodic basis throughout the system. The number of tests that are done is three times more than required. The results consistently demonstrate that the water delivered to you meets or exceeds all federal and state regulations.
Do I need a home water treatment device?
OUC neither recommends nor discourages buying any specific point-of-use treatment device. We encourage you to investigate the claims made and to check the actual performance of a home treatment device before and after installing the unit. Such a decision is a matter of personal preference, especially regarding the taste or softness of either.
Is there copper or lead in OUC water?
The natural copper or lead content of the water OUC delivers to you is well within federal and state safe drinking water standards. However, there may be instances that OUC customers have higher than normal levels of copper or lead in their drinking water because of prolonged exposure of the water to the plumbing or fixtures in their homes or businesses.
Can the risk of exposure to copper or lead be reduced?
Yes, we now treat the water to reduce its natural corrosiveness and to help prevent copper or lead from leaching into water from customers’ plumbing. In addition, you can help by:
- Use cold water from your tap (never hot) for cooking, drinking, or making ice.
- Let your cold water faucet run for about 30 seconds if it has not been used for an hour or longer. This will rinse away any temporary buildup of copper, lead, or other minerals that may occur in your plumbing fixtures (Use that water for plants or washing dishes.)
Related Content

Efficiency Rebates
Apply online for rebates on 20+ water and energy-saving upgrades—from heat pump A/C units to smart irrigation controllers and even EVs.

Save Energy & Water Tips
Discover simple things you can do to conserve energy and water—and save money! Learn how you can help the environment and your wallet with OUC.

Our Sustainability Goals
OUC leads in sustainable practices and customer programs, committing millions of dollars to new technology, all with a goal of net-zero CO2 emissions by 2050.
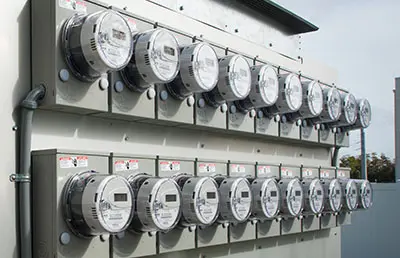
Digital Smart Meters
Learn how to read OUC’s digital meters so you can track your energy and water usage online on your myOUC account.
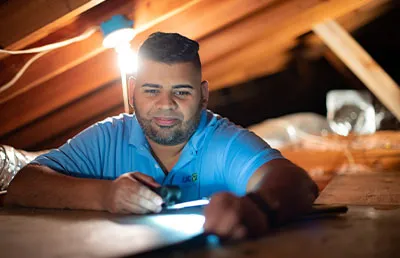
Conservation Audits
Get a free energy and water assessment from an OUC specialist to understand your usage and find ways to lower your utility bills at home or in your business.

Service Rates & Costs
OUC offers transparent utility rates and costs. View our electric rates, water rates and more to better understand your billing and options.